MultiMADirection [pietherrieck]this indicator looks for the direction of multiple moving averages (pointing up/down). if all show the same signal it is colored red (sell) or green (buy). if there are different signals it will turn gray (neutral). it should be used on the 4h or 1d timeframe. use the atr-value (small number next to the indicator name (MMAD)) as stop-loss. for example on eur/usd 0.0144 means a 144 pip stop-loss. if the color changes close the postition.
Search in scripts for "stop loss"

Statistcal Daily Profile & Ranges# Statistical Daily Profile & Ranges - TradingView Publication Guide
## Overview
The **Statistical Daily Profile & Ranges** indicator is a comprehensive tool designed to analyze intraday session behavior and daily range characteristics. It combines Average Daily Range (ADR) projection levels with detailed session-by-session statistics and probability-based trading insights derived from historical price action patterns.
## What This Indicator Does
This indicator provides traders with three core analytical components:
1. **ADR Projection Levels** - Dynamic support/resistance levels based on historical daily ranges
2. **Session Range Analysis** - Visual boxes and statistical breakdowns for four key trading sessions
3. **Dynamic Probability Display** - Real-time probability statistics based on overnight session relationships
## How It Works
### Average Daily Range (ADR) Calculation
The indicator calculates the average daily range over a user-defined lookback period (default: 10 days) and projects this range from each day's opening price. This creates two key levels:
- **ADR High**: Opening price + average daily range
- **ADR Low**: Opening price - average daily range
- **ADR Median**: The opening price (middle of the projected range)
These levels are recalculated at the start of each trading day and extend forward, providing dynamic support and resistance zones based on recent volatility characteristics.
### Session Tracking & Statistics
The indicator monitors four distinct trading sessions (times in Eastern Time):
1. **Asia Session** (8:00 PM - 2:00 AM)
2. **London Session** (2:00 AM - 8:00 AM)
3. **NY Open** (8:00 AM - 9:00 AM)
4. **NY Initial Balance** (9:30 AM - 10:30 AM)
For each session, the indicator:
- Draws a colored box showing the session's high-to-low range
- Tracks the opening price, high, and low
- Stores historical data for statistical analysis
- Calculates average ranges by day of week (Monday through Friday)
The session statistics are displayed in a customizable table showing average point ranges for each session across different weekdays, helping traders identify which sessions and days typically produce the most movement.
### Dynamic Probability System
The indicator analyzes the relationship between the Asia and London sessions to determine the current market setup. After the London session closes, it automatically detects one of four possible conditions:
**1. London Engulfs Asia**
- London session breaks both above Asia's high AND below Asia's low
- This indicates strong momentum during the European session
- Most common occurrence pattern
**2. Asia Engulfs London**
- Asia session range completely contains the London session range
- Indicates consolidation during London hours
- Relatively rare pattern (occurs approximately 5.36% of the time)
**3. London Partially Engulfs Upwards**
- London breaks above Asia's high but stays above Asia's low
- Suggests bullish momentum continuation from Asia into London
**4. London Partially Engulfs Downwards**
- London breaks below Asia's low but stays below Asia's high
- Suggests bearish momentum continuation from Asia into London
Once a condition is detected, the indicator displays a probability table showing historically observed outcomes for that specific setup, including:
- Probability of NY session taking out key levels (Asia high/low, London high/low)
- Probability of NY session engulfing the entire overnight range
- Directional bias for NY Cash session (9:30 AM - 4:00 PM)
## How to Use This Indicator
### Initial Setup
1. Add the indicator to your chart (works on any intraday timeframe below Daily)
2. Adjust the **ADR Days** setting (default: 10) to control the lookback period for range calculation
3. Adjust the **Session Lookback Days** setting (default: 50) to determine how much historical data feeds the statistics tables
### Reading the ADR Levels
- Use the **ADR High** and **ADR Low** lines as potential profit targets or areas where price may encounter resistance
- The **ADR Median** line represents the opening price and can act as a pivot point for intraday directional bias
- If price reaches the ADR High early in the session, it suggests strong bullish momentum; conversely for ADR Low
- These levels adapt daily based on recent volatility, making them more responsive than static levels
### Interpreting Session Boxes
- **Session boxes** visually highlight when each trading session is active and its price range
- Larger boxes indicate higher volatility during that session
- Compare current session ranges to the statistical averages shown in the table
- Sessions that are unusually quiet or active relative to historical averages may signal compression or expansion
### Using the Session Statistics Table
- The table shows average point ranges for each session broken down by weekday
- Identify which sessions typically produce the most movement on specific days
- For example, if London on Thursdays averages 40 points while Mondays average 25 points, you can adjust position sizing or expectations accordingly
- The **Total** column shows the overall average across all days
- Sample sizes (shown in brackets if enabled) indicate data reliability
### Trading with the Probability Table
The probability table updates dynamically after the London session closes and shows statistically probable outcomes based on 12 years of NQ futures data.
**Important Limitations:**
- **These probabilities are derived from NQ (Nasdaq E-mini futures) data only**
- **Do NOT apply these probability statistics to other instruments** (ES, stocks, forex, etc.)
- The probabilities represent historical frequencies, not guarantees
- Always combine with your own analysis, risk management, and market context
**How to Apply the Probabilities:**
When **London Engulfs Asia**:
- Watch for NY session to take out London's extremes (72.33% probability for high, 71.12% for low)
- Slight bullish bias in NY Cash session (54.80% vs 45.20%)
- Lower probability of complete overnight engulfment (44.13%)
When **Asia Engulfs London** (rare - 5.36% occurrence):
- Higher probability NY takes Asia's high (75.86%)
- Moderately high probability NY takes Asia's low (65.52%)
- Slight increase in bullish bias (58.42% vs 41.58%)
- Recognize this as an unusual setup
When **London Partially Engulfs Upwards**:
- Very high probability NY takes London high (81.51%)
- Strong probability NY takes London low (64.45%)
- Moderate probability NY takes Asian low (53.16%)
- Slight bullish bias (55.52%)
When **London Partially Engulfs Downwards**:
- Very high probability NY takes London low (75.29%)
- Strong probability NY takes London high (68.80%)
- Moderate probability NY takes Asian high (56.44%)
- Slight bullish bias maintained (52.99%)
### Practical Trading Applications
**Scenario 1: Range Projection**
If the ADR is 500 points and the market opens at 25,000:
- ADR High: 25,500 (potential resistance/target)
- ADR Low: 24,500 (potential support/target)
- Monitor how price interacts with these levels throughout the day
**Scenario 2: Session-Based Trading**
Using the statistics table, you notice London on Wednesdays averages 35 points. During a Wednesday London session:
- If London has already moved 30 points, the session may be exhausting its typical range
- If London has only moved 15 points with an hour remaining, there may be expansion potential
- Adjust stop losses and targets based on typical session behavior
**Scenario 3: Probability-Based Setup**
It's 8:05 AM ET and the indicator shows "London Partially Engulfs Upwards":
- You now know there's an 81.51% historical probability NY will take out London's high
- There's a 53.16% probability NY will reach down to Asia's low
- The NY Cash session has a slight bullish bias (55.52%)
- Consider this alongside your technical analysis for directional bias and level targeting
## Customization Options
### Visual Settings
- **Line Width**: Adjust thickness of ADR levels
- **ADR Color/Style**: Customize appearance of ADR projection lines (solid, dashed, dotted)
- **Median Line**: Toggle visibility and customize appearance separately
- **Session Box Colors**: Customize each session's box color independently
- **Show Session Boxes**: Toggle session box visibility on/off
### Label Settings
- **ADR Labels**: Show/hide labels for ADR High and ADR Low, adjust size
- **Median Label**: Separate control for median line label
- **Session Labels**: Show/hide session name labels, adjust size
- **Label Colors**: Customize text colors for all labels
### Table Settings
- **Session Stats Table**: Position (9 locations available), size (Tiny to Huge), toggle on/off
- **Sample Sizes**: Show/hide the number of historical samples used for each calculation
- **Probabilities Table**: Separate position and size controls, toggle on/off
### Session Times
- Each session's time range can be customized to fit different markets or preferences
- All times are in Eastern Time (America/New_York timezone)
## Technical Notes
### Data Requirements
- The indicator requires sufficient historical data based on your lookback settings
- Minimum recommended: 50+ days of intraday data for reliable statistics
- Works on any timeframe below Daily (1-minute, 5-minute, 15-minute, etc.)
### Calculation Methodology
- **ADR Calculation**: Simple average of absolute daily high-low ranges
- **Session Statistics**: Mean average of ranges for each session filtered by day of week
- **Condition Detection**: Boolean logic comparing session high/low relationships
- All calculations update in real-time as new bars form
### Probability Data Source
The probability statistics displayed in the dynamic table are derived from:
- **Dataset**: 12 years of NQ (Nasdaq E-mini futures) historical data
- **Methodology**: Frequency analysis of outcomes following specific setup conditions
- **Time Period**: Multiple market cycles including various volatility regimes
**Critical Warning**: These probabilities are specific to NQ and reflect that instrument's behavior patterns. Market microstructure, participant behavior, and volatility characteristics differ significantly across instruments. Do not apply these NQ-derived probabilities to other markets (ES, RTY, YM, individual stocks, forex, commodities, etc.).
## Best Practices
1. **Combine with Other Analysis**: Use this indicator as one component of a complete trading methodology, not a standalone system
2. **Respect Risk Management**: Probabilities are not certainties; always use proper position sizing and stop losses
3. **Context Matters**: High-impact news events, holiday trading, and extreme volatility can invalidate typical patterns
4. **Verify Statistics**: Monitor your own results and compare to the displayed probabilities
5. **Adapt Session Times**: If trading instruments with different active hours, adjust session times accordingly
6. **Regular Calibration**: Periodically review if the session averages and probabilities remain relevant to current market conditions
## Understanding Originality
This indicator is original in its approach to combining three analytical frameworks into a single tool:
1. **Dynamic ADR Projection**: Unlike static pivot points, these levels adapt daily based on recent volatility
2. **Session-Specific Statistics**: Goes beyond simple volume profiles by quantifying average ranges for specific time windows across weekdays
3. **Conditional Probability Display**: Automatically detects overnight session relationships and displays relevant probability data rather than showing all scenarios simultaneously
The conditional logic system that determines which probability set to display is a key differentiator—traders only see the statistics relevant to the current market setup, reducing information overload and improving decision-making clarity.
## Summary
The **Statistical Daily Profile & Ranges** indicator provides traders with a comprehensive framework for understanding daily range potential, session-specific behavior patterns, and probability-based setup analysis. By combining ADR projection levels with detailed session statistics and dynamic probability displays, traders gain multiple perspectives on potential price movement within the trading day.
The indicator is most effective when used to:
- Set realistic profit targets based on average daily range
- Identify which sessions typically produce movement on specific weekdays
- Understand probability-weighted outcomes for different overnight setup conditions (NQ only)
- Visualize session ranges and compare them to historical averages
Remember that all statistical analysis reflects historical patterns, and market behavior can change. Always combine indicator signals with sound risk management, proper position sizing, and your own market analysis.

PMax & MOST SynergyIntroduction
This script brings together two of the most powerful trend-following and volatility-based trailing stop-loss indicators in the technical analysis world: Profit Maximizer (PMax) and Moving Stop Loss (MOST). By merging these two tools into a single, optimized script, this indicator aims to reduce chart clutter while providing a comprehensive trend-tracking solution. Both indicators are integrated with their original logic and default parameters, now fully compatible with the latest Pine Script v5 standards.
Development & Technical Logic
The indicator is designed for versatility, allowing traders to monitor dual layers of protection and trend confirmation.
PMax Integration: It utilizes the volatility-adjusted trailing stop-loss logic combined with a variety of selectable Moving Average types (SMA, EMA, VAR, etc.). In this version, the default PMax settings are pre-configured to utilize the Variable Moving Average (VAR) to ensure smoother trend detection with reduced lag.
MOST Integration: The script includes the Moving Stop Loss (MOST) logic, which provides a dynamic exit strategy based on percentage-based trailing stops.
Visual Enhancements: The PMax line has been visually updated to a distinct Blue color for better clarity, and all secondary signals (Support/Resistance lines and highlights) are set to be optional to keep the interface clean and professional.
Conclusion
This combined version is an ideal tool for trend followers who want to benefit from multiple confirmation layers. Whether you are looking for long-term trend stability with PMax or tactical exit/entry signals with MOST, this script provides the flexibility to adjust both independently. It eliminates the need for multiple indicator slots and offers a unified dashboard for trend analysis across various timeframes and assets.
Acknowledgements
I would like to express my sincere gratitude to the original developers who designed these essential tools:
Kivanc Ozbilgic (@KivancOzbilgic): Thank you for your immense contribution to the trading community and for developing the Profit Maximizer (PMax). Your work continues to be a cornerstone for many traders worldwide.
Ceyhun (@ceyhun): A special thanks for designing the Moving Stop Loss (MOST) indicator. Your innovative approach to trailing stops has significantly improved how we manage risk in the markets.

Hybrid Strategy: Trend/ORB/MTFHybrid Strategy: Trend + ORB + Multi-Timeframe Matrix
This script is a comprehensive "Trading Manager" designed to filter out noise and identify high-probability breakout setups. It combines three powerful concepts into a single, clean chart interface: Trend Alignment, Opening Range Breakout (ORB), and Multi-Timeframe (MTF) Analysis.
It is designed to prevent "analysis paralysis" by providing a unified Dashboard that confirms if the trend is aligned across 5 different timeframes before you take a trade.
How it Works
The strategy relies on the "Golden Trio" of confluence:
1. Trend Definition (The Setup) Before looking for entries, the script analyzes the immediate trend. A bullish trend is defined as:
Price is above the Session VWAP.
The fast EMA (9) is above the slow EMA (21). (The inverse applies for bearish trends).
2. The Signal (The Trigger) The script draws the Opening Range (default: first 15 minutes of the session).
Buy Signal: Price breaks above the Opening Range High while the Trend is Bullish.
Sell Signal: Price breaks below the Opening Range Low while the Trend is Bearish.
3. The Confirmation (The Filter) A signal is only valid if the Higher Timeframe (default: 60m) agrees with the direction. If the 1m chart says "Buy" but the 60m chart is bearish, the signal is filtered out to prevent false breakouts.
Key Features
The Matrix Dashboard A zero-lag, real-time table in the corner of your screen that monitors 5 user-defined timeframes (e.g., 5m, 15m, 30m, 60m, 4H).
Trend: Checks if Price > EMA 21.
VWAP: Checks if Price > VWAP.
ORB: Checks if Price is currently above/below the Opening Range of that session.
D H/L: Warns if price is near the Daily High or Low.
PD H/L: Warns if price is near the Previous Daily High or Low.
Visual Order Blocks The script automatically identifies valid Order Blocks (sequences of consecutive candles followed by a strong explosive move).
Chart: Draws Green/Red zones extending to the right, showing where price may react.
Dashboard: Displays the exact High, Low, and Average price of the most recent Order Blocks for precision planning.
Risk Management (Trailing Stop) Once a trade is active, the script plots Chandelier Exit dots (ATR-based trailing stop) to help you manage the trade and lock in profits during trend runs.
Visual Guide (Chart Legend)
⬜ Gray Box: Represents the Opening Range (first 15 minutes). This is your "No Trade Zone." Wait for price to break out of this box.
🟢 Green Line: The Opening Range High. A break above this line signals potential Bullish momentum.
🔴 Red Line: The Opening Range Low. A break below this line signals potential Bearish momentum.
🟢 Green / 🔴 Red Zones (Boxes): These are Order Blocks.
🟢 Green Zone: A Bullish Order Block (Demand). Expect price to potentially bounce up from here.
🔴 Red Zone: A Bearish Order Block (Supply). Expect price to potentially reject down from here.
⚪ Dots (Trailing Stop):
🟢 Green Dots: These appear below price during a Bullish trend. They represent your suggested Stop Loss.
🔴 Red Dots: These appear above price during a Bearish trend.
🏷️ Buy / Sell Labels:
BUY: Triggers when Price breaks the Green Line + Trend is Bullish + HTF is Bullish.
SELL: Triggers when Price breaks the Red Line + Trend is Bearish + HTF is Bearish.
Settings
Session: Customizable RTH (Regular Trading Hours) to filter out pre-market noise.
Matrix Timeframes: 5 fixed slots to choose which timeframes you want to monitor.
Order Blocks: Adjust the sensitivity and lookback period for Order Block detection.
Risk: Customize the ATR multiplier for the trailing stop.
Disclaimer
This tool is for educational purposes only. Past performance does not guarantee future results. Always manage your risk properly.

UK100 London Judas & IFVG SetupUK100 London Judas & IFVG Setup
Overview This indicator is a specialized trading tool designed to automate the ICT Judas Swing strategy specifically for the UK100 (FTSE 100) index during the London Market Open. It combines institutional time-based logic with price action confirmation using Inversion Fair Value Gaps (IFVG) to identify high-probability reversal setups.
How It Works The strategy is based on the concept that the initial move after the London Open is often a "fake-out" (manipulation) designed to trap retail traders and engineer liquidity before the true trend of the day begins.
Session & Opening Price:
The script marks the London Open price (default 09:00 Warsaw / 08:00 London time) with a dashed line.
This serves as the "line in the sand." Prices moving away from this line initially are monitored for manipulation.
Judas Swing (Liquidity Sweep):
If price moves BELOW the open, it is hunting Sell-Side Liquidity (trapping sellers).
If price moves ABOVE the open, it is hunting Buy-Side Liquidity (trapping buyers).
The Entry Trigger: Inversion FVG (IFVG):
The indicator scans for Fair Value Gaps (FVG) created during the manipulation phase.
BUY Signal: The price manipulates lower, creates a Bearish FVG (Red Box), but then aggressively reverses and closes ABOVE that gap. The gap is now "Inverted" (turns Green), acting as support.
SELL Signal: The price manipulates higher, creates a Bullish FVG (Green Box), but then aggressively reverses and closes BELOW that gap. The gap is now "Inverted" (turns Orange), acting as resistance.
Key Features
Automated Pattern Recognition: No need to manually draw gaps. The script detects valid FVG inversions that align with the Judas Swing logic.
Built-in Risk Calculator: The signal labels display the exact Lot Size you should use based on your account balance and risk percentage (default 0.5%). It calculates this dynamically based on the Stop Loss distance.
Institutional Targets: The indicator fetches H1 Fractals (Liquidity) from the 1-hour timeframe and plots them on your 1-minute chart as blue lines. These are your primary Take Profit (TP) levels.
Stop Loss Visualization: Automatically suggests a Stop Loss placement behind the swing high/low of the reversal structure.
How to Use
Timeframe: Set your chart to 1 Minute (1m).
Asset: UK100 (FTSE 100).
Wait: Allow the London session to open. Watch for price to move away from the opening line.
Execute: When a BUY or SELL label appears:
Enter the trade using the Lot Size shown on the label.
Set your Stop Loss at the price shown on the label.
Target the blue H1 Liquidity lines for profit taking.
Settings
Timezone: Set this to your chart/exchange timezone (Default: Europe/Warsaw).
Account Balance: Input your current trading capital (e.g., 100,000) for accurate risk calculations.
Risk Per Trade %: The percentage of your account you are willing to lose if the Stop Loss is hit (Standard: 0.5% - 1.0%).
Contract Size: The value of 1 point movement (Check your broker's specifications. Usually 1 for CFDs).
Alerts You can set a single alert in TradingView to capture all signals. Select the indicator and choose "Any alert() function call". You will receive a notification with the direction (Buy/Sell), Entry Price, and Lot Size.

Neosha Concept V4 (NY Time)
Imagine the financial market as a huge ocean. Millions of traders throw orders into it every second. But beneath all the noise, there is a powerful current that quietly controls where the waves move. That current is not a person, not a trader, and not random—it is an algorithm.
This algorithm is called the Interbank Price Delivery Algorithm (IPDA).
Think of it as the “navigation system” that guides price through the market.
IPDA has one job:
to move prices in a way that keeps the market efficient and liquid.
To do this, it constantly looks for two things:
1. Where liquidity is hiding
Liquidity is usually found above highs and below lows—where traders place stop losses. The algorithm moves price there first to collect that liquidity.
2. Where price became unbalanced
Sometimes price moves too fast and creates gaps or imbalances. IPDA returns to those areas later to “fix” the missing orders.
Once you start looking at the charts with this idea in mind, everything makes more sense:
Why price suddenly spikes above a high and crashes down
Why big moves leave gaps that price later fills
Why the market reverses right after taking stops
Why trends begin only after certain levels are hit
These are not accidents.
They are the algorithm doing its job.
Price moves in a repeating cycle:
Gather liquidity
Make a strong move (displacement)
Return to fix inefficiency
Deliver to the next target
Most beginners only see the candles.
But once you understand IPDA, you see the intention behind the candles.
Instead of guessing where price might go, you begin to understand why it moves there.
And once you understand the “why,” your trading becomes clearer, calmer, and far more accurate.

Trend Gazer: Unified ICT Trading System with Signals# Trend Gazer User Guide (English)
## 📖 Table of Contents
1. (#about-this-indicator)
2. (#quick-start-guide-3-steps)
3. (#detailed-usage)
4. (#settings-customization)
5. (#why-combine-multiple-features)
6. (#faq)
---
## About This Indicator
**Trend Gazer** is an integrated trading system designed to read institutional order flow like professional traders.
### 🎯 3 Problems This Indicator Solves
#### ❌ Problem 1: Too Many Indicators = Information Overload
```
Normal: RSI + MACD + Moving Average + Bollinger Bands... → Cluttered chart
Solution: All integrated into ONE indicator → Clean & Clear
```
#### ❌ Problem 2: Single Indicators Give False Signals
```
Normal: Enter based on RSI alone → Frequent stop-outs
Solution: Structure × Zone × Momentum multi-angle confirmation → Higher win rate
```
#### ❌ Problem 3: Unclear Entry Timing
```
Normal: Know the trend but don't know WHERE to enter
Solution: LS Bounce Signal shows EXACT entry points
```
---
## Quick Start Guide (3 Steps)
### 🚀 STEP 1: Confirm Trend Direction
**Look for CHoCH (Change of Character)**
```
📍 (1.CHoCH) label = Uptrend starting
📍 (a.CHoCH) label = Downtrend starting
```
**Important**: Wait for CHoCH! No direction without it.
---
### 🎯 STEP 2: Find Entry Points
**Wait for LS Bounce Signal (green/red labels)**
```
🟢 "Long@ HL only" label → LONG (buy) candidate
🔴 "Short@ LH only" label → SHORT (sell) candidate
```
**Label text color meaning**:
- **White text**: Clean trend (high confidence)
- **Yellow text**: Trend transition (moderate caution)
---
### 🛡️ STEP 3: Final Confirmation with Bar Color
**Bar color shows market state**
```
🔴 Red bar: BUY zone (buying is favored)
🟢 Green bar: SELL zone (selling is favored)
⚪ White bar: Neutral (wait and see)
```
---
## Detailed Usage
### 📊 Understanding the Chart
#### 1. Labels (Market Structure Changes)
```
(1.CHoCH) / (a.CHoCH) : Trend reversal
(2.SiMS) / (b.SiMS) : Momentum confirmation
(3.BoMS) / (c.BoMS) : Trend continuation
```
#### 2. Boxes (Institutional Order Zones)
```
📦 Blue boxes: Bullish OB (buy orders accumulated)
📦 Red boxes: Bearish OB (sell orders accumulated)
📦 Black transparent boxes: Liquidity Sweep
```
**How to use Order Blocks**:
- Function as support/resistance
- Signals within OB have higher reliability
- Use for stop-loss placement
#### 3. Lines (Trends and Support/Resistance)
```
━━━ Red lines: EMA20, EMA50, EMA100 (short to mid-term trends)
━━━ Blue lines: 60min NPR/BB bands (support/resistance)
```
#### 4. Bar Colors (Filter 6)
```
Bar color = Real-time market state
🔴 Red: Buying is favored
🟢 Green: Selling is favored
⚪ White: Neutral
```
---
### 🎯 Practical Trading Flow
#### 📍 Preparation Phase
```
1. Open chart (recommended: 5min or 15min)
2. Add Trend Gazer to chart
3. Start in observation mode (don't enter yet)
```
#### 📍 Entry Decision
```
✅ CHoCH confirms direction → Uptrend starting
✅ LS Bounce Signal "Long@ HL only" appears
→ Entry point candidate
✅ Bar turns red → Market supports buying
→ Entry decision 🎯
✅ Place stop below nearest Order Block (blue box)
```
#### 📍 Exit Decision
```
🔴 Opposite LS Bounce Signal "Short@ LH only" appears
→ Consider taking profit
🔴 Bar turns green
→ Potential trend reversal, review position
🔴 Stop loss hit
→ Exit with loss
```
---
### 💡 Tips for Higher Win Rate
#### ✅ DO's
```
1. Enter AFTER CHoCH appears
2. Prioritize white-text LS Bounce Signals
3. Check higher timeframe (1H or Daily) trend
4. Emphasize signals within Order Blocks
5. Use bar color as final confirmation
```
#### ❌ DON'Ts
```
1. Enter before CHoCH → No clear direction
2. Enter only on yellow text → Unstable transition period
3. Ignore bar color → Trading against market state
4. Don't check Order Blocks → Unclear support/resistance
5. Enter same direction consecutively → Overtrading
```
---
## Settings Customization
### 🔧 How to Open Settings
```
1. Right-click on indicator name on chart
2. Select "Settings..."
3. Settings panel opens
```
---
### 📋 Recommended Setting Profiles
#### 🔰 Beginner Settings (Simple)
**Goal**: Reduce noise, show only important signals
```
【FILTERS】
✅ Bonus Filter: ON
✅ Filter 6 (OB/BB/NPR Zone Filter): ON
❌ Direction Filter: OFF
❌ Liquidation Reversal Filter: OFF
❌ ICT Market Structure Filter: OFF
❌ EMA Trend Filter: OFF
❌ OB/FVG Filter 1: OFF
❌ OB/FVG Filter 2: OFF
【SIGNALS】
✅ Signal 0 (Bonus): ON
✅ Signal 1 (VWC Change): ON
✅ Signal 2 (Liq Rev): ON
❌ Signal 3 (LS): OFF (complex alone)
❌ Signal 4 (LS Break): OFF
❌ Signal 5 (OB+LS NPR): OFF
❌ Signal 6 (OB+LS EMA): OFF
【LS BOUNCE SIGNAL】
✅ Exclude EMA50 from touch detection: OFF
❌ Only show when EMA fills are mixed: OFF
```
**What happens with this setup**:
- Only Bonus (black background) signals display
- LS Bounce Signals clearly visible
- Noisy signals filtered out
---
#### 💪 Intermediate Settings (Balanced)
**Goal**: Enable key filters for better accuracy
```
【FILTERS】
✅ Bonus Filter: ON
✅ Filter 6 (OB/BB/NPR Zone Filter): ON
✅ ICT Market Structure Filter: ON
❌ Direction Filter: OFF
❌ Liquidation Reversal Filter: OFF
❌ EMA Trend Filter: OFF
❌ OB/FVG Filter 1: OFF
❌ OB/FVG Filter 2: OFF
【SIGNALS】
✅ Signal 0 (Bonus): ON
✅ Signal 1 (VWC Change): ON
✅ Signal 2 (Liq Rev): ON
✅ Signal 3 (LS): ON
❌ Signal 4 (LS Break): OFF
❌ Signal 5 (OB+LS NPR): OFF
❌ Signal 6 (OB+LS EMA): OFF
【LS BOUNCE SIGNAL】
✅ Exclude EMA50 from touch detection: OFF
❌ Only show when EMA fills are mixed: OFF
```
**What happens with this setup**:
- Signals only after CHoCH (trend confirmed)
- Filter 6 changes bar colors
- Liquidity Sweeps also displayed
---
#### 🚀 Advanced Settings (Full Utilization)
**Goal**: Master all features
```
【FILTERS】
✅ Bonus Filter: ON
✅ Filter 6 (OB/BB/NPR Zone Filter): ON
✅ ICT Market Structure Filter: ON
✅ Direction Filter: ON
✅ EMA Trend Filter: ON
❌ Liquidation Reversal Filter: OFF (optional)
✅ OB/FVG Filter 1: ON
✅ OB/FVG Filter 2: ON
【SIGNALS】
✅ All ON
【LS BOUNCE SIGNAL】
✅ Exclude EMA50 from touch detection: ON (reduce EMA50 noise)
✅ Only show when EMA fills are mixed: ON (show only transition zones)
```
**What happens with this setup**:
- Fewer signals (precision-focused)
- Multiple confirmations greatly reduce false signals
- Only signals confirmed by trend, momentum, and zones
---
### 🎨 Display Customization
#### Change Label Size
```
【BUY/SELL SIGNAL APPEARANCE】
→ "BUY/SELL Label Size"
→ Choose from: tiny / small / normal / large / huge
Recommended: small (default)
```
#### Order Block Display Settings
```
【ORDER BLOCK (OB) SETTINGS】
✅ Show Current TF OB: Current timeframe OB
✅ Show 1min OB: 1-minute OB
✅ Show 5min OB: 5-minute OB
✅ Show 15min OB: 15-minute OB
Recommended: Only 15min OB ON (simple)
```
#### Liquidity Sweep Display
```
【LIQUIDITY SWEEPS SETTINGS】
→ "Sweep Length": Sensitivity (small=frequent, large=selective)
→ "Sweep Option": Standard / Maximum
Recommended: Length=40, Option=Standard
```
#### NPR/BB Bands Display
```
【NPR (NON-REPAINT STDEV) SETTINGS】
✅ Display 60min NPR Bands: 60-minute support/resistance
❌ Display Current TF NPR Bands: Current timeframe (optional)
Recommended: Only 60min ON
```
---
### ⚙️ Advanced Settings
#### Fine-tune Filter 6
```
【FINAL FILTERS】
→ "Enable Filter 6 (OB/BB/NPR Zone Filter)"
When ON:
- Bars color-coded red/green/white
- Behavior at OB, NPR/BB touches controlled
```
#### LS Bounce Signal Adjustments
```
【LS BOUNCE SIGNAL】
→ "Exclude EMA50 from touch detection"
OFF: Detect NPR/BB/EMA50 (all 3)
ON: Detect NPR/BB only (exclude EMA50)
→ "Only show when EMA fills are mixed"
OFF: Show all LS Bounce Signals
ON: Show only transition zone signals (yellow text)
```
#### MTF (Multi-Timeframe) Control
```
【ORDER BLOCK (OB) SETTINGS】
→ "Disable MTF on 1hr+ Charts"
ON: Disable MTF on 1H+ (save memory)
OFF: MTF enabled on all timeframes
Recommended: ON (unnecessary on larger timeframes)
```
---
### 🎯 Purpose-Based Configuration Guide
#### 🔍 Goal 1: Reduce Signal Count
```
✅ Bonus Filter: ON
✅ ICT Market Structure Filter: ON
✅ Filter 6: ON
✅ All Signals OFF, only Signal 0 ON
```
#### 🔍 Goal 2: Get More Signals
```
❌ All Filters OFF
✅ All Signals ON
```
#### 🔍 Goal 3: Trend Following Only
```
✅ ICT Market Structure Filter: ON
✅ Direction Filter: ON
✅ EMA Trend Filter: ON
```
#### 🔍 Goal 4: Counter-Trend Trading
```
✅ LS Bounce Signal: ON
✅ Filter 6: ON
❌ ICT Market Structure Filter: OFF
```
#### 🔍 Goal 5: Day Trading (5-15min charts)
```
✅ Show 15min OB: ON
✅ Display 60min NPR Bands: ON
✅ LS Bounce Signal: ON
❌ Show 1min/5min OB: OFF
```
#### 🔍 Goal 6: Scalping (1-5min charts)
```
✅ Show 5min OB: ON
✅ Show 15min OB: ON
✅ Display 60min NPR Bands: ON
✅ All Signals: ON
```
---
### 💾 Saving and Loading Settings
#### Save Settings
```
1. Click "..." in top-right of Settings screen
2. Select "Save as default"
→ Same settings auto-applied next time
```
#### Reset Settings
```
1. Click "..." in top-right of Settings screen
2. Select "Reset settings"
→ Return to default settings
```
---
## Why Combine Multiple Features?
### 🎯 Problem: Single Indicator Limitations
Common trader problems:
```
❌ RSI alone → Trade against trend, lose
❌ Moving Average alone → Late entry timing
❌ Support/Resistance alone → Caught by false breakouts
```
**Markets are complex**. One angle isn't enough.
---
### 💡 Solution: Multi-Angle Integrated Approach
#### 1️⃣ Structure × Zone × Momentum
```
📐 Structure (ICT CHoCH)
→ "Which direction is likely?"
📦 Zone (OB/NPR/BB)
→ "Where will price react?"
💨 Momentum (EMA/VWC)
→ "Is there momentum now?"
```
**When all 3 align = Highest win-rate timing**
---
#### 2️⃣ Multi-Timeframe Analysis
```
Big picture: Confirm Daily direction
Medium-term: Check 1H Order Blocks
Short-term: Time entry on 5min
```
**Short-term entries aligned with higher timeframes = Better win rate**
---
#### 3️⃣ Understanding Liquidity
```
🎣 Institutional strategy:
1. Intentionally move price opposite to stop out retail
2. Then, move in real direction
💡 Liquidity Sweep = Visualize this "trap"
→ Read institutional order flow
```
---
### 🧠 Integration Examples
#### Case 1: RSI Alone vs Integrated System
**Scenario**: RSI at 30 (oversold)
```
❌ RSI-only decision:
→ "Buy!"
→ But downtrend continues, loss 😢
✅ Trend Gazer:
CHoCH check → Still downtrend ❌
Order Block → In Bearish OB ❌
LS Bounce → SHORT signal only ❌
→ Skip or SHORT
→ Avoid loss ✅
```
**Result**: Multiple filters block wrong entry
---
#### Case 2: LS Bounce Signal 2-Stage Logic
**Scenario**: Price touches 60min NPR lower band
```
🔍 Traditional method:
Touched → Buy!
→ But price continues down 😢
✅ Trend Gazer:
Stage 1: NPR touch + red bar → Flag ON
Stage 2: EMA20 crosses above EMA50 → Confirm bounce
→ Now "Long@ HL only" displays
→ Entry → Success ✅
```
**Result**: Not just "touch" but "touch + bounce confirmation" improves accuracy
---
### 🎓 Progressive Learning Design
This indicator is designed for **beginners to advanced**:
```
📖 Beginner (Month 1):
Use only CHoCH + LS Bounce Signal
→ Learn trend and entry points
📖 Intermediate (Months 2-3):
Add Order Block + Bar Color
→ Learn support/resistance and filtering
📖 Advanced (Month 6+):
Master all features
→ Read institutional order flow
```
**Ultimate goal**: Indicator becomes confirmation tool. Your market sense becomes primary.
---
### 🔬 Technical Advantages
#### 1. Non-Repaint STDEV (NPR)
```
Normal Bollinger Bands:
→ Past data changes (repaints)
→ Inaccurate backtesting
NPR:
→ Past data doesn't change (non-repaint)
→ Reliable verification possible
```
#### 2. 2-Stage Signal Logic
```
Traditional: Condition met → Immediate signal
→ Many false signals
Trend Gazer: Condition1 → Flag ON → Condition2 → Signal
→ Confirmation step improves accuracy
```
#### 3. Alternating Filter
```
Problem: Same-direction signals spam
→ Overtrading
Solution: LONG → SHORT → LONG alternating only
→ Prevent unnecessary entries
```
---
### 💎 Conclusion: Why Integration?
```
Single indicator = "Partial truth"
Integrated system = "3D market perspective"
```
**Markets are multifaceted**. One angle isn't enough.
Trend Gazer **integrates multiple screens pros watch simultaneously into ONE**,
allowing beginners to read charts with institutional perspective.
---
## FAQ
### ❓ Q1: Which timeframe is best?
**A**: Depends on trading style
```
Scalping: 1min ~ 5min
Day Trading: 5min ~ 15min
Swing: 1H ~ 4H
```
**Important**: LS Bounce Signal only works on 30min and below.
---
### ❓ Q2: Too many signals, confused
**A**: Enable filters
```
【Recommended Settings】
✅ Bonus Filter: ON
✅ Filter 6: ON
✅ ICT Market Structure Filter: ON
→ Show only Signal 0
```
This significantly reduces signal count.
---
### ❓ Q3: No CHoCH appearing, what to do?
**A**: Wait or check higher timeframe
```
Method 1: Wait for CHoCH (recommended)
Method 2: Check higher timeframe (e.g., Daily) for trend
Method 3: Disable ICT Filter (not recommended)
```
**When trend is unclear, sitting out is also strategy**.
---
### ❓ Q4: LS Bounce Signal not appearing
**A**: Checkpoints
```
1. Are you on 30min or below chart?
→ Doesn't show on 1H+
2. Are NPR/BB bands displayed?
→ Check Settings "Display 60min NPR Bands"
3. Is EMA50 excluded?
→ If "Exclude EMA50" is ON, EMA50 signals won't show
```
---
### ❓ Q5: Bar color not changing?
**A**: Check Filter 6
```
Settings → FINAL FILTERS
→ Confirm "Enable Filter 6 (OB/BB/NPR Zone Filter)" is ON
If ON but still not changing:
→ Current price may be outside OB/NPR/BB zones
```
---
### ❓ Q6: Too many Order Blocks, hard to see
**A**: Narrow down displayed OBs
```
Settings → ORDER BLOCK (OB) SETTINGS
Recommended:
❌ Show Current TF OB: OFF
❌ Show 1min OB: OFF
❌ Show 5min OB: OFF
✅ Show 15min OB: ON (only this)
```
---
### ❓ Q7: How to improve win rate?
**A**: Thorough multiple confirmations
```
Checklist:
✅ CHoCH appeared
✅ LS Bounce Signal (white text)
✅ Bar color matches (red bar=LONG, green bar=SHORT)
✅ Signal within Order Block
✅ Aligns with higher timeframe trend
Enter ONLY when all align
```
---
### ❓ Q8: Want to practice on demo
**A**: Recommended practice method
```
Week 1: Observation only
→ Watch signals and chart movement
→ Resist entering
Weeks 2-3: Keep records
→ Screenshot when signal appears
→ Record subsequent movement
Week 4+: Start demo trading
→ Start with small amounts
→ Continue keeping records
```
---
### ❓ Q9: Are there alert features?
**A**: Yes, multiple alerts available
```
Setup method:
1. Right-click indicator on chart
2. Select "Add Alert..."
3. Choose from:
- ANY ALERT: BUY/SELL Signals
- BUY ONLY ALERT
- SELL ONLY ALERT
- MS UP / MS DOWN
- BAR COLOR: RED / LIME
- LS BOUNCE: LONG / SHORT Signal
```
---
### ❓ Q10: Works on other markets?
**A**: Yes, works on all markets
```
✅ Cryptocurrency (BTC, ETH, etc.)
✅ Forex (EUR/USD, USD/JPY, etc.)
✅ Stocks (individual stocks, indices)
✅ Futures (oil, gold, etc.)
```
Works on any market with price and volume data.
---
## 📋 Disclaimer
### ⚠️ Important Notice
This indicator is for **educational and informational purposes only**.
```
❌ NOT investment advice
❌ Does NOT guarantee profits
❌ Past results do NOT guarantee future performance
```
### Risk Warning
```
⚠️ Trading involves substantial risk
⚠️ Only trade with funds you can afford to lose
⚠️ Practice extensively on demo account before live trading
⚠️ Make your own informed decisions and act at your own risk
```
---
## 📞 Support
### Feedback & Questions
Feel free to ask questions in TradingView comments section.
### Bug Reports
Please report with specific details (timeframe, symbol, screenshots).
---
**Author**: rasukaru666
**License**: Mozilla Public License 2.0
**Last Updated**: December 2025
**Version**: Latest
---
**Thank you for using Trend Gazer!**
**Happy Trading! 📈**
---------------

PDH/PDL Breakout Pip MeasurerThis indicator measures the maximum distance (in pips or points) that price travels after breaking through the Previous Day's High (PDH) or Previous Day's Low (PDL), before returning to a user-defined stop loss level. It provides statistical insights into breakout behavior for systematic trading analysis.
Input Parameters
Pip Multiplier: Adjust for different instruments (0.0001 for Forex, 1 for indices)
Bull Stop Loss Pips: Distance below PDH to define stop loss for bull breakouts
Bear Stop Loss Pips: Distance above PDL to define stop loss for bear breakouts
Show Table: Toggle statistics table display
Show Labels: Display pip measurements on chart
Show Levels: Toggle PDH/PDL level visibility
Statistics Table Includes
Total breakout counts (Bull/Bear/Combined)
Average pip distance per breakout type
Minimum and maximum recorded moves
Currently active breakout measurement

EMA Market Structure [BOSWaves]EMA Market Structure - Trend-Driven Structural Mapping with Adaptive Swing Detection
Overview
The EMA Market Structure indicator provides an advanced framework for visualizing market structure through dynamically filtered trend and swing analysis.
Unlike conventional EMA overlays, which merely indicate average price direction, this model integrates trend acceleration, swing highs/lows, and break-of-structure (BOS) logic into a unified, visually intuitive display.
Each element adapts in real time to price movement, offering traders a living map of support, resistance, and trend bias that reacts fluidly to market momentum.
The result is a comprehensive, trend-aware representation of price structure.
EMA slope and acceleration guide trend perception, while swing points identify key inflection zones.
Breaks of prior highs or lows are highlighted with visual BOS labels and stop-loss projections, giving traders actionable context for continuation or reversal setups.
Unlike static lines or simple moving averages, the EMA Market Structure indicator fuses dynamic trend analysis with structural awareness to provide a clear picture of market bias and potential turning points.
Theoretical Foundation
The EMA Market Structure builds on principles of momentum filtering and structural analysis.
Standard moving averages track average price but ignore acceleration and context; this indicator captures both the directional slope of the EMA and its rate of change, providing a proxy for trend strength.
Simultaneously, swing detection identifies statistically significant highs and lows, while BOS logic flags decisive breaks in structure, aligned with trend direction.
At its core are three interacting components:
EMA Trend & Acceleration : Smooths price data while highlighting acceleration changes, producing gradient-driven color cues for trend momentum.
Swing Detection Engine : Identifies swing highs and lows over configurable bar lengths, ensuring key turning points are captured with minimal clutter.
Break-of-Structure Logic : Detects price breaches of previous swings and aligns them with EMA trend for actionable BOS signals, including projected stop-loss levels for tactical decision-making.
By integrating these elements, the system scales effectively across timeframes and assets, maintaining structural clarity while visualizing trend dynamics in real time. Traders receive both macro and micro perspectives of market movement, with clear cues for trend continuation or reversal.
How It Works
The EMA Market Structure indicator operates through layered processing stages:
EMA Slope & Acceleration : Calculates the EMA and its rate of change, normalizing via ATR and a smoothing function to produce gradient color coding. This allows instant visual identification of bullish or bearish momentum.
Swing Identification : Swing highs and lows are computed using configurable left/right bar lengths, filtered through a cool-off mechanism to prevent redundant signals and maintain chart clarity.
Structural Lines & Zones : Swing points are connected with lines, and shaded zones are drawn between successive highs/lows to highlight key support and resistance regions.
Break-of-Structure Detection : BOS events occur when price breaches a prior swing in alignment with the EMA trend. Bullish and bearish BOS signals include enhanced label effects and projected stop-loss lines and zones, providing immediate tactical reference.
Dynamic Background Mapping : The chart background adapts to EMA trend direction, reinforcing trend context with subtle visual cues.
Through these processes, the indicator creates a living, adaptive map of market structure that reflects both trend strength and swing-based inflection points.
Interpretation
The EMA Market Structure reframes market reading from simple trend following to structured awareness of price behavior:
Uptrend Phases : EMA is rising with positive acceleration, swings confirm higher lows, and BOS events occur above prior highs, signaling trend continuation.
Downtrend Phases : EMA slope is negative, swings form lower highs, and BOS events occur below prior lows, confirming bearish bias.
Trend Reversals : Flat or decelerating EMA with BOS failures may indicate impending structural change.
Critical Zones : Swing-based lines and shaded zones highlight areas where price may pause, reverse, or accelerate, providing high-probability decision points.
Visually, EMA color gradients, structural lines, and BOS labels combine to provide both statistical trend confirmation and actionable structural cues.
Strategy Integration
EMA Market Structure integrates seamlessly into trend-following and swing-based trading systems:
Trend Alignment : Confirm higher-timeframe EMA slope before entering continuation trades.
BOS Entry Triggers : Use BOS events aligned with EMA trend for tactical entries and stop placement.
Support/Resistance Mapping : Swing lines and zones help define areas for scaling, exits, or reversals.
Volatility Context : ATR-based smoothing and stop-loss buffers accommodate varying market volatility, ensuring robustness across conditions.
Multi-Timeframe Coordination : Combine higher-timeframe EMA trend and swings with lower-timeframe structural events for precision entries.
Technical Implementation Details
Core Engine : EMA slope and ATR-normalized acceleration for gradient-driven trend visualization.
Swing Framework : Pivot-based high/low detection with configurable bar lengths and cool-off intervals.
Structural Visualization : Lines, zones, and labels for high-fidelity mapping of support/resistance and BOS events.
BOS Engine : Detects structural breaks aligned with EMA trend, automatically plotting stop-loss lines and visual cues.
Performance Profile : Lightweight, optimized for real-time responsiveness across multiple timeframes.
Optimal Application Parameters
Timeframe Guidance:
1 - 5 min : Ideal for intraday swing spotting and microstructure trend tracking.
15 - 60 min : Medium-range structural analysis and BOS-driven entries.
4H - Daily : Macro trend mapping and key swing-based support/resistance identification.
Suggested Configuration:
EMA Length : 50
Swing Length : 5
Swing Cooloff : 10 bars
BOS Cooloff : 15 bars
SL Buffer : 0.1%
These suggested parameters should be used as a baseline; their effectiveness depends on the asset volatility, liquidity, and preferred entry frequency, so fine-tuning is expected for optimal performance.
Performance Characteristics
High Effectiveness:
Trending markets with defined swings and structural consistency.
Markets where EMA slope and acceleration reliably indicate momentum changes.
Reduced Effectiveness:
Choppy or sideways markets with minimal swing definition.
Random walk assets lacking clear structural anchors.
Integration Guidelines
Confluence Framework : Combine with volume, momentum, or BOSWaves structural indicators
to validate entries.
Directional Control: Follow EMA slope and BOS alignment for high-conviction trades.
Risk Calibration: Use SL projections for disciplined exposure management.
Multi-Timeframe Synergy: Confirm higher-timeframe trend before executing lower-timeframe structural trades.
Disclaimer
The EMA Market Structure is a professional-grade trend and structure visualization tool. It is not predictive or guaranteed profitable; performance depends on parameter tuning, market regime, and disciplined execution. BOSWaves recommends using it as part of a comprehensive analytical stack integrating trend, liquidity, and structural context.

Psychological LevelsADVANCED PSYCHOLOGICAL LEVELS - PROFESSIONAL FOREX INDICATOR
This highly customizable indicator automatically identifies and visualizes all major psychological price levels across any Forex chart. Psychological levels represent critical price zones where traders naturally congregate their orders due to human psychology's attraction to round numbers. These levels consistently act as powerful support and resistance zones in the market.
🎯 KEY FEATURES:
✅ Four Distinct Level Types - Choose from 1000-pip, 100-pip, 50-pip, 25-pip, and 10-pip psychological levels
✅ Individual Color Customization - Each level type has its own customizable zone and line colors
✅ Separate Zone Width Control - Adjust zone width independently for each level type
✅ Universal Forex Compatibility - Automatically adapts to JPY pairs and all other currency pairs
✅ Extended Coverage - Displays levels far beyond the visible chart area for comprehensive analysis
✅ Fixed Positioning - Levels remain stationary when scrolling or zooming
✅ Fully Customizable Styling - Choose between solid, dashed, or dotted line styles
📊 LEVEL TYPES EXPLAINED:
🟣 1000-pip Levels (e.g., EUR/USD: 1.0000, 2.0000 | USD/JPY: 100.00, 110.00, 120.00)
The strongest macro-level psychological barriers in the Forex market
Represent massive institutional, long-term price zones
Extremely important for position traders, swing traders, and macro analysis
Used by hedge funds, banks, and large liquidity providers for major order placement
Ideal for identifying long-term support/resistance, trend reversals, and market structure shifts
Default color: Purple (highest, macro-level importance)
🔴 100-pip Levels (e.g., EUR/USD: 1.1000, 1.1100, 1.1200 | USD/JPY: 150.00, 151.00, 152.00)
The most significant psychological barriers in Forex trading
Major round numbers where institutional traders place large orders
Strongest support and resistance zones with highest reaction probability
Essential for swing trading and position trading strategies
Default color: Red (highest importance)
🟠 50-pip Levels (e.g., EUR/USD: 1.1050, 1.1150, 1.1250 | USD/JPY: 150.50, 151.50, 152.50)
Secondary psychological levels positioned midway between 100-pip levels
Important intermediate zones for profit-taking and order clustering
Highly effective for day trading strategies
Reliable targets for partial profit exits
Default color: Orange (medium-high importance)
🔵 25-pip Levels (e.g., EUR/USD: 1.1025, 1.1075, 1.1125 | USD/JPY: 150.25, 150.75, 151.25)
Quartile levels providing granular market structure
Perfect for scalping and short-term trading approaches
Excellent confluence zones with technical indicators
Ideal for tight stop-loss placement
Default color: Blue (medium importance)
🟢 10-pip Levels (e.g., EUR/USD: 1.1010, 1.1020, 1.1030 | USD/JPY: 150.10, 150.20, 150.30)
Most detailed psychological levels for precision trading
Optimal for micro scalping and high-frequency strategies
Provides fine-grained market structure analysis
Useful for optimizing entry and exit timing
Default color: Green (detailed analysis)
⚙️ CUSTOMIZATION OPTIONS:
Color Settings (Individual for Each Level):
Zone Color - Customize fill color with adjustable transparency
Line Color - Set center line color independently
Default color scheme uses traffic light logic (Purple → Red → Orange → Blue → Green)
Zone Width Settings (Separate for Each Level):
1000-pip Levels: Default 15 pips (widest zones for long-term significance)
100-pip Levels: Default 8 pips (wider zones for major levels)
50-pip Levels: Default 5 pips (medium zones)
25-pip Levels: Default 3 pips (smaller zones)
10-pip Levels: Default 2 pips (narrowest zones for precision)
Display Settings:
Line Style: Choose between Solid, Dashed, or Dotted
Line Thickness: Adjustable from 1 to 5 pixels
Level Selection: Toggle each level type on/off independently
💡 TRADING APPLICATIONS:
📈 Support & Resistance Identification
Instantly recognize where price is likely to react
Identify key reversal zones before they occur
Combine with price action for high-probability setups
🎯 Optimal Entry & Exit Points
Enter trades at psychological support/resistance
Set realistic profit targets at the next psychological level
Improve win rate by trading with market psychology
🛡️ Strategic Stop-Loss Placement
Position stops just beyond psychological levels to avoid stop hunts
Reduce premature stop-outs by understanding where others place stops
Protect profits by moving stops to psychological levels
💰 Profit Target Optimization
Set take-profit orders at psychological levels where profit-taking occurs
Scale out positions at multiple psychological levels
Maximize gains by understanding where demand/supply shifts
📊 Breakout Trading
Identify when price decisively breaks through major psychological barriers
Trade momentum when psychological levels are breached
Confirm breakouts using multiple level types as confluence
⚖️ Risk Management Enhancement
Calculate better risk-reward ratios using psychological levels
Size positions based on distance to next psychological level
Improve overall trading consistency
🔬 WHY PSYCHOLOGICAL LEVELS WORK:
Psychological levels are self-fulfilling prophecies in financial markets. Because thousands of traders worldwide monitor the same round numbers, these levels naturally attract significant order flow:
Order Clustering: Pending buy/sell orders accumulate at round numbers
Profit Taking: Traders instinctively close positions at psychological levels
Stop Hunts: Market makers often push price to psychological levels to trigger stops
Institutional Activity: Banks and funds use round numbers for large order placement
Pattern Recognition: Human brains naturally gravitate toward simple, round numbers
📋 TECHNICAL SPECIFICATIONS:
✓ Pine Script Version 6 (latest)
✓ Compatible with all Forex pairs (majors, minors, exotics)
✓ Works on all timeframes (M1 to Monthly)
✓ Automatic JPY pair detection and adjustment
✓ Maximum 500 lines and 500 boxes for optimal performance
✓ Levels extend infinitely across the chart
✓ No repainting - levels are fixed once drawn
✓ Efficient calculation prevents performance issues
✓ Clean visualization without chart clutter
👥 IDEAL FOR:
Day Traders: Use 100-pip and 50-pip levels for intraday setups
Swing Traders: Focus on major 100-pip levels for multi-day positions
Scalpers: Enable 25-pip and 10-pip levels for precision entries
Position Traders: Use 100-pip levels for long-term support/resistance analysis
Beginner Traders: Learn to recognize important market structure easily
Algorithm Developers: Incorporate psychological levels into automated strategies
🚀 HOW TO USE:
Add the indicator to any Forex chart
Select which level types you want to display (100, 50, 25, 10)
Customize colors to match your chart theme
Adjust zone widths based on your trading style and timeframe
Choose line style (solid, dashed, or dotted)
Watch for price reactions at the highlighted psychological zones
Use the levels to plan entries, exits, and stop-loss placement
💎 BEST PRACTICES:
✓ Combine with candlestick patterns for confirmation signals
✓ Wait for price action confirmation before entering trades
✓ Use multiple timeframes to identify the most significant levels
✓ Disable 10-pip levels on higher timeframes to reduce visual noise
✓ Enable only 100-pip levels for clean, uncluttered analysis on Daily/Weekly charts
✓ Adjust zone widths based on pair volatility (wider for volatile pairs)
✓ Use color coding to instantly recognize level importance
⚡ PERFORMANCE OPTIMIZED:
This indicator is engineered for maximum efficiency:
Smart calculation only within visible price range
Duplicate prevention system avoids overlapping levels
Optimized loops with early break conditions
Extended coverage (500 bars) without performance degradation
Handles thousands of levels across all timeframes smoothly
🎨 VISUAL DESIGN:
The default color scheme follows intuitive importance levels:
Purple (1000-pip): Macro-level, highest significance
Red (100-pip): Highest importance - major barriers
Orange (50-pip): Medium-high importance - secondary levels
Blue (25-pip): Medium importance - tertiary levels
Green (10-pip): Detailed analysis - precision levels
This traffic-light inspired system allows instant visual recognition of level significance.
📚 EDUCATIONAL VALUE:
Beyond being a trading tool, this indicator serves as an excellent educational resource for understanding market psychology and how professional traders think. It visually demonstrates where the "crowd" is likely to place orders, helping you develop better market intuition.
🔄 CONTINUOUS UPDATES:
This indicator displays levels dynamically based on the current price range, ensuring you always see relevant psychological levels no matter where price moves on the chart.
✨ WHAT MAKES THIS INDICATOR UNIQUE:
Unlike simple horizontal line indicators, this advanced tool offers:
Individual customization for each level type (colors, widths)
Automatic currency pair detection and adjustment
Visual zones (not just lines) for better support/resistance visualization
Extended coverage ensuring levels are always visible
Professional color-coding system for instant level importance recognition
Performance-optimized for handling hundreds of levels simultaneously
⭐ PERFECT FOR ALL TRADING STYLES:
Whether you're a conservative position trader looking at weekly charts or an aggressive scalper on 1-minute timeframes, this indicator adapts to your needs. Simply enable the appropriate level types and adjust the visualization to match your strategy.
Transform your Forex trading with professional-grade psychological level analysis. Add this indicator to your chart today and start trading with the market psychology on your side!

Psychological levelsADVANCED PSYCHOLOGICAL LEVELS - PROFESSIONAL FOREX INDICATOR
This highly customizable indicator automatically identifies and visualizes all major psychological price levels across any Forex chart. Psychological levels represent critical price zones where traders naturally congregate their orders due to human psychology's attraction to round numbers. These levels consistently act as powerful support and resistance zones in the market.
🎯 KEY FEATURES:
✅ Four Distinct Level Types - Choose from 100-pip, 50-pip, 25-pip, and 10-pip psychological levels
✅ Individual Color Customization - Each level type has its own customizable zone and line colors
✅ Separate Zone Width Control - Adjust zone width independently for each level type
✅ Universal Forex Compatibility - Automatically adapts to JPY pairs and all other currency pairs
✅ Extended Coverage - Displays levels far beyond the visible chart area for comprehensive analysis
✅ Fixed Positioning - Levels remain stationary when scrolling or zooming
✅ Fully Customizable Styling - Choose between solid, dashed, or dotted line styles
📊 LEVEL TYPES EXPLAINED:
🔴 100-pip Levels (e.g., EUR/USD: 1.1000, 1.1100, 1.1200 | USD/JPY: 150.00, 151.00, 152.00)
The most significant psychological barriers in Forex trading
Major round numbers where institutional traders place large orders
Strongest support and resistance zones with highest reaction probability
Essential for swing trading and position trading strategies
Default color: Red (highest importance)
🟠 50-pip Levels (e.g., EUR/USD: 1.1050, 1.1150, 1.1250 | USD/JPY: 150.50, 151.50, 152.50)
Secondary psychological levels positioned midway between 100-pip levels
Important intermediate zones for profit-taking and order clustering
Highly effective for day trading strategies
Reliable targets for partial profit exits
Default color: Orange (medium-high importance)
🔵 25-pip Levels (e.g., EUR/USD: 1.1025, 1.1075, 1.1125 | USD/JPY: 150.25, 150.75, 151.25)
Quartile levels providing granular market structure
Perfect for scalping and short-term trading approaches
Excellent confluence zones with technical indicators
Ideal for tight stop-loss placement
Default color: Blue (medium importance)
🟢 10-pip Levels (e.g., EUR/USD: 1.1010, 1.1020, 1.1030 | USD/JPY: 150.10, 150.20, 150.30)
Most detailed psychological levels for precision trading
Optimal for micro scalping and high-frequency strategies
Provides fine-grained market structure analysis
Useful for optimizing entry and exit timing
Default color: Green (detailed analysis)
⚙️ CUSTOMIZATION OPTIONS:
Color Settings (Individual for Each Level):
Zone Color - Customize fill color with adjustable transparency
Line Color - Set center line color independently
Default color scheme uses traffic light logic (Red → Orange → Blue → Green)
Zone Width Settings (Separate for Each Level):
100-pip Levels: Default 10 pips (wider zones for major levels)
50-pip Levels: Default 7 pips (medium zones)
25-pip Levels: Default 5 pips (smaller zones)
10-pip Levels: Default 3 pips (narrowest zones for precision)
Display Settings:
Line Style: Choose between Solid, Dashed, or Dotted
Line Thickness: Adjustable from 1 to 5 pixels
Level Selection: Toggle each level type on/off independently
💡 TRADING APPLICATIONS:
📈 Support & Resistance Identification
Instantly recognize where price is likely to react
Identify key reversal zones before they occur
Combine with price action for high-probability setups
🎯 Optimal Entry & Exit Points
Enter trades at psychological support/resistance
Set realistic profit targets at the next psychological level
Improve win rate by trading with market psychology
🛡️ Strategic Stop-Loss Placement
Position stops just beyond psychological levels to avoid stop hunts
Reduce premature stop-outs by understanding where others place stops
Protect profits by moving stops to psychological levels
💰 Profit Target Optimization
Set take-profit orders at psychological levels where profit-taking occurs
Scale out positions at multiple psychological levels
Maximize gains by understanding where demand/supply shifts
📊 Breakout Trading
Identify when price decisively breaks through major psychological barriers
Trade momentum when psychological levels are breached
Confirm breakouts using multiple level types as confluence
⚖️ Risk Management Enhancement
Calculate better risk-reward ratios using psychological levels
Size positions based on distance to next psychological level
Improve overall trading consistency
🔬 WHY PSYCHOLOGICAL LEVELS WORK:
Psychological levels are self-fulfilling prophecies in financial markets. Because thousands of traders worldwide monitor the same round numbers, these levels naturally attract significant order flow:
Order Clustering: Pending buy/sell orders accumulate at round numbers
Profit Taking: Traders instinctively close positions at psychological levels
Stop Hunts: Market makers often push price to psychological levels to trigger stops
Institutional Activity: Banks and funds use round numbers for large order placement
Pattern Recognition: Human brains naturally gravitate toward simple, round numbers
📋 TECHNICAL SPECIFICATIONS:
✓ Pine Script Version 6 (latest)
✓ Compatible with all Forex pairs (majors, minors, exotics)
✓ Works on all timeframes (M1 to Monthly)
✓ Automatic JPY pair detection and adjustment
✓ Maximum 500 lines and 500 boxes for optimal performance
✓ Levels extend infinitely across the chart
✓ No repainting - levels are fixed once drawn
✓ Efficient calculation prevents performance issues
✓ Clean visualization without chart clutter
👥 IDEAL FOR:
Day Traders: Use 100-pip and 50-pip levels for intraday setups
Swing Traders: Focus on major 100-pip levels for multi-day positions
Scalpers: Enable 25-pip and 10-pip levels for precision entries
Position Traders: Use 100-pip levels for long-term support/resistance analysis
Beginner Traders: Learn to recognize important market structure easily
Algorithm Developers: Incorporate psychological levels into automated strategies
🚀 HOW TO USE:
Add the indicator to any Forex chart
Select which level types you want to display (100, 50, 25, 10)
Customize colors to match your chart theme
Adjust zone widths based on your trading style and timeframe
Choose line style (solid, dashed, or dotted)
Watch for price reactions at the highlighted psychological zones
Use the levels to plan entries, exits, and stop-loss placement
💎 BEST PRACTICES:
✓ Combine with candlestick patterns for confirmation signals
✓ Wait for price action confirmation before entering trades
✓ Use multiple timeframes to identify the most significant levels
✓ Disable 10-pip levels on higher timeframes to reduce visual noise
✓ Enable only 100-pip levels for clean, uncluttered analysis on Daily/Weekly charts
✓ Adjust zone widths based on pair volatility (wider for volatile pairs)
✓ Use color coding to instantly recognize level importance
⚡ PERFORMANCE OPTIMIZED:
This indicator is engineered for maximum efficiency:
Smart calculation only within visible price range
Duplicate prevention system avoids overlapping levels
Optimized loops with early break conditions
Extended coverage (500 bars) without performance degradation
Handles thousands of levels across all timeframes smoothly
🎨 VISUAL DESIGN:
The default color scheme follows intuitive importance levels:
Red (100-pip): Highest importance - major barriers
Orange (50-pip): Medium-high importance - secondary levels
Blue (25-pip): Medium importance - tertiary levels
Green (10-pip): Detailed analysis - precision levels
This traffic-light inspired system allows instant visual recognition of level significance.
📚 EDUCATIONAL VALUE:
Beyond being a trading tool, this indicator serves as an excellent educational resource for understanding market psychology and how professional traders think. It visually demonstrates where the "crowd" is likely to place orders, helping you develop better market intuition.
🔄 CONTINUOUS UPDATES:
This indicator displays levels dynamically based on the current price range, ensuring you always see relevant psychological levels no matter where price moves on the chart.
✨ WHAT MAKES THIS INDICATOR UNIQUE:
Unlike simple horizontal line indicators, this advanced tool offers:
Individual customization for each level type (colors, widths)
Automatic currency pair detection and adjustment
Visual zones (not just lines) for better support/resistance visualization
Extended coverage ensuring levels are always visible
Professional color-coding system for instant level importance recognition
Performance-optimized for handling hundreds of levels simultaneously
⭐ PERFECT FOR ALL TRADING STYLES:
Whether you're a conservative position trader looking at weekly charts or an aggressive scalper on 1-minute timeframes, this indicator adapts to your needs. Simply enable the appropriate level types and adjust the visualization to match your strategy.

MTF Trading Helper & Multi AlertsHi dear fellows, I´m using this indicator for my trading, so every then and when I will publish updates on this one.
This indicator should help to identify the right trading setup. I´m using it to trade index futures and stocks.
MTF Trading Helper & Multi Alerts
Overview
This indicator provides a clear visual representation of trend direction across three timeframes. It helps traders identify trend alignment, potential reversals, and optimal entry/exit points by analyzing the relationship between different smoothed timeframes.
You can set up multiple alerts (as one alert in Tradingview)
How It Works
The indicator displays three colored circles representing the smoothed candle direction on three different timeframes:
Bottom plot represents the overall trend direction, the plot in the middle shows intermediate momentum, and the one on top captures short-term price action.
When a color change occurs, the circle appears in a darker shade to highlight the transition.
🟢 Green = Bullish - 🔴 Red = Bearish
This change can also trigger multiple alerts.
Timeframe Settings - important
Choose between two trading setups, either for:
Intraday 1-minute candles or 1h for swing trading. Set up your chart accordingly to that timeframe.
Intraday | 1Min chart candles
Swing | 1 hour chart candles
Plots
TF3 represents the overall trend direction (bottom), TF2 shows intermediate momentum (middle), and TF1 captures short-term price action (top).
Interpretation & Strategy Alerts
1. Trend Bullish (TF3 turns Green)
The higher timeframe has shifted bullish - a potential new uptrend is forming.
Example: You're watching ES-mini on the Intraday setting. TF3 turns green after being red for several days. This signals the broader trend may be shifting bullish - consider looking for long opportunities.
2. Trend Bearish (TF3 turns Red)
The higher timeframe has shifted bearish - consider protecting profits or exiting long positions.
Example: You hold a long position in Es-mini. TF3 turns red, indicating the macro trend is weakening. This is your signal to take profits or tighten stop-losses.
3. Possible Accumulation (TF3 Red + TF2 turns Green)
While the overall trend is still bearish, the medium timeframe shows buying pressure. Smart money may be accumulating - watch closely for a potential trend reversal.
Example: Es-mini has been in a downtrend (TF3 red). Suddenly TF2 turns green while TF3 remains red. This could indicate institutional buying before a reversal. Don't buy yet, but add it to your watchlist and wait for confirmation.
4. Trend Continuation (TF3 Green + TF2 turns Green)
The medium timeframe realigns with the bullish macro trend - a potential buying opportunity as momentum returns to the uptrend.
Example: Es-mini is in an uptrend (TF3 green). After a pullback, TF2 was red but now turns green again. The pullback appears to be over - this is a trend continuation signal and a potential entry point.
5. Buy the Dip (TF3 + TF2 Green + TF1 turns Green)
All timeframes are now aligned bullish. The short-term pullback is complete and price is resuming the uptrend - optimal entry for short-term trades.
Example: Es-mini is trending up (TF3 + TF2 green). A small dip caused TF1 to turn red briefly. When TF1 turns green again, all three timeframes are aligned - this is your "Buy the Dip" signal with strong confirmation.
6. Sell the Dip (TF3 + TF2 Green + TF1 turns Red)
Short-term weakness within an uptrend. This can be used to take partial profits, wait for a better entry, or trail stops tighter.
Example: You're long on ES-mini with TF3 and TF2 green. TF1 turns red, indicating short-term selling pressure. Consider taking partial profits here and wait for TF1 to turn green again (Buy the Dip) to add back to your position.
How to Use
Choose your scenario: Select "Intraday" 1min-chart for day trading or "Swing" 1h-chart for swingtrading
Enable alerts: Turn on the strategy alerts you want to receive in the settings
Wait for signals: Let the indicator notify you when conditions align
Confirm with price action: Always use additional confirmation before entering trades
Best Practices
✅ Use TF3 as your trend filter - only take longs when TF3 turns green and hold them :)
✅ Use TF2 for timing - wait for TF2 to align with TF3 for swings.
✅ Use TF2 for early entries (accumulation phase) when TF3 is still red. Watch out!
✅ Use TF1 for entries when TF3 and TF2 are green. Only buy if TF1 is red. Keep it short and sweet.
✅ Combine with support/resistance levels for better entries
✅ Use proper risk management - no indicator is 100% accurate
Disclaimer
This indicator is for educational purposes only. Past performance does not guarantee future results. Always do your own research and use proper risk management. Never risk more than you can afford to lose.

jhehli LiquidityWhat are BSL and SSL?
In the context of Smart Money Concepts, liquidity simply refers to pending orders—specifically Stop Losses and Buy/Sell Stop orders—resting above old highs and below old lows.
BSL (Buy-Side Liquidity): This is found above Swing Highs. Retail traders who are short the market will place their "Buy Stop" protective orders here. Additionally, breakout traders place "Buy Limit" orders here. Smart Money views this area as a pool of willing buyers. To fill large sell orders, institutions must drive price up into this liquidity to pair their massive sell interest with these buy stops.
SSL (Sell-Side Liquidity): This is found below Swing Lows. Retail traders who are long the market place their "Sell Stop" protective orders here. Smart Money targets these levels to accumulate long positions. They need the market to sell off into these levels so they can buy from the willing sellers at a discount.
How this Indicator Works
This tool automates the process of market structure analysis by identifying key Swing Highs and Swing Lows.
Detection: It scans price action to find fractal highs and lows (classic swing points) where price has rejected a level.
Visualization: It projects a line from these points, clearly marking where the "stops" are likely residing.
Liquidity Raids: When price pierces these levels, it is considered a "Liquidity Raid" or "Stop Hunt."
How to Use This in Your Trading
Do not treat these lines simply as Support and Resistance. In the ICT methodology, old highs and lows are targets, not barriers.
For Reversals: Wait for a "Turtle Soup" or "Judas Swing." This occurs when price aggressively expands into a BSL or SSL level to trigger stops, only to quickly reverse back into the trading range. This indicates that Smart Money has finished their accumulation or distribution.
For Bias: If the higher timeframe trend is Bullish, expect SSL to be raided to fuel the move, while BSL becomes the target (Draw on Liquidity).
By using this indicator, you remove the guesswork of manually marking every swing point, allowing you to focus on price action and the reaction at these critical liquidity pools.

Delta Zones Smart Money Concept (SMC) UT Trend Reversal Mul.Sig.🚀 What's New in This Version (V5 Update)
This version is a major overhaul focused on improving trade entry timing and risk management through enhanced UT Bot functionality:
Integrated UT Trailing Stop (ATR-based): The primary trend filter and moving stop-loss mechanism is now fully integrated.
Pre-Warning Line: A revolutionary feature that alerts traders when the price penetrates a specific percentage distance (customizable) from the UT Trailing Stop before the main reversal signal fires.
"Ready" Signal: Plots a "Ready" warning label on the chart and triggers an alert condition (UT Ready Long/Short) for pre-emptive trade preparation.
V5 Compatibility: All code has been optimized for Pine Script version 5, utilizing the modern array and type structures for efficient Order Block and Breaker Block detection.
💡 How to Use This Indicator
This indicator works best when confirming signals across different components:
1. Identify the Trend Bias (UT Trailing Stop)
Uptrend: UT Trailing Stop line is Green (Focus only on Buy/Long opportunities).
Downtrend: UT Trailing Stop line is Red (Focus only on Sell/Short opportunities).
2. Prepare for Entry (Warning Line)
Action: When you see the "Ready" label or the price hits the Pre-Warning Line (Dotted Orange Line), this is your alert to prepare for a trend flip, or to tighten the stop on your current trade.
3. Confirm the Entry (Multi-Signals)
Look for a primary entry signal that aligns with the desired trend:
High-Conviction Entry: Wait for the UT Buy/Sell label (confirmed trend flip) AND a Combined Buy/Sell arrow (confirmed by your selected Oscillator settings).
High-Liquidity Entry: Look for a Delta Zone Box forming near an active Order Block or Breaker Block (SMC zones), and then confirm with a UT or Combined Signal.
4. Manage Risk (Trailing Stop)
Always set your initial Stop Loss (SL) either just outside the opposite Order Block or at the UT Trailing Stop level itself.
If the price closes back across the UT Trailing Stop, exit your position immediately, as the trend bias has officially shifted.
Features & Components
1. Delta Zones (Liquidity/Wick Pressure)
Identifies periods of extreme buying or selling pressure based on wick-to-body ratios and standard deviation analysis.
Plots colored pressure boxes (Buy/Sell) to highlight potential exhaustion points or institutional activity.
2. Smart Money Concepts (SMC)
Automatically detects and plots Order Blocks (OBs) and Breaker Blocks (BBs) based on confirmed Market Structure Breaks (MSBs).
Includes Chop Control logic to remove less reliable Breaker Blocks.
3. UT Bot Trailing Stop & Warning Line
UT Trailing Stop (ATR-based): Plots a dynamic trend line (Green/Red) that acts as a moving stop-loss and primary trend filter.
Ready/Warning Signals: Alerts traders (via the "Ready" label and orange lines) when the price enters a "Pre-Reversal Zone" near the Trailing Stop.
4. Multi-Indicator Confirmation (Filters)
Includes customizable signals based on the crossover/crossunder of RSI, CCI, and Stochastic indicators against configurable Overbought/Oversold levels.
Allows selection of combination signals (e.g., RSI & CCI, All Combined, etc.) for high-conviction entries.

The Bear & Bull TieWhat it does:
Bear & Bull Tie is a moving average crossover indicator that identifies trend reversals and generates entry/exit signals based on the relationship between price and three simple moving averages (SMA 21, SMA 55, SMA 89). The indicator combines these three MAs into an Average Moving Average (AMA) to confirm directional bias, then uses ATR (Average True Range) volatility measurement for dynamic position sizing and stop-loss placement.
How it works:
The indicator operates on a simple but effective principle: it enters a bullish trend when price closes above all three moving averages simultaneously, and enters a bearish trend when price closes below all three MAs simultaneously. This "three MA alignment" approach filters out noise and confirms genuine trend changes. The indicator then plots:
Entry levels at the highest MA during uptrends or lowest MA during downtrends
Stop-loss zones calculated using 2x ATR distance from entry prices
Trend confirmation fill between price and the Average Moving Average, color-coded blue for bullish and red for bearish
The ATR-based stop-loss sizing adapts to market volatility, making it suitable for different market conditions and timeframes.
How to use it:
Monitor the filled zones to visually confirm your trend bias
Watch for alerts when new long or short setups form; entry prices and ATR-based stops are displayed on the chart
Trade the zones between your entry level and stop-loss zone, adjusting position size based on your risk tolerance
Exit when colors reverse to indicate trend termination
The indicator works best on higher timeframes (1H and above) where trend clarity is stronger and false signals are reduced.
Alerts: FOR AUTOMATION / NOTIFICATION's (create an alert for B/B tie (2, 4) that uses Any Alert / Function Call )
Long Positions:
entries ---> "Bull Tie on NVDA | Entry : 100.5 | ATR Stop : 99.5"
exits ------> "Bull Tie on NVDA | Exit : 110.1"
Short Positions:
entries ---> "Bear Tie on NVDA | Entry : 120.05 | ATR Stop : 85.05"
exits -----> "Bear Tie on NVDA | Exit : 100"
Credits:
This script incorporates concepts and code portions from @LOKEN94 with his explicit permission. Special thanks for the foundational logic that inspired this development.
Disclaimer:
This indicator is for educational and analytical purposes. It is not financial advice. Past performance does not guarantee future results. Always manage risk properly and use stops. Test thoroughly on historical data before live trading.

ATR Risk Display - Multi FuturesWhat This Does
I got tired of manually calculating my ATR stops and risk for different futures contracts, especially when switching between ES, NQ, and their micro versions. This indicator automatically detects what futures symbol you're trading and shows you the exact tick count and dollar risk for your stop loss.
The Problem It Solves
If you trade futures with ATR-based stops, you know the hassle:
Different contracts have different tick values
You need to calculate position risk in dollars
Switching between symbols means redoing all the math
Renko charts make it even more confusing since ATR needs to come from regular candles
This handles all of that automatically.
Key Features
Auto-detects futures symbols - ES, NQ, YM, RTY, GC, CL, and all the micros (MES, MNQ, etc.)
Shows everything you need in one line: ATR(timeframe) × multiplier = X ticks ($XXX)
Works on Renko charts - pulls ATR from regular timeframe charts (super important if you use Renko)
Adjustable position sizing - set your contract count and see total risk instantly
Clean, minimal display - just the info you need, no clutter
How to Use
Add it to any futures chart
Set your preferred ATR timeframe (I use 5-minute)
Set your ATR multiplier (I use 1.5x for my stops)
Set your contract size
That's it - the indicator handles the rest
The display will show something like: "ES ATR(5) × 1.5 = 12 ticks ($150)"
Settings Explained
ATR Timeframe: What timeframe to calculate ATR from (always uses regular candles, even on Renko)
ATR Multiplier: How many ATRs for your stop (1.5 is common, 2.0 for wider stops)
Number of Contracts: Your position size for risk calculation
Auto-Detect Symbol: Leave on unless you want to manually override
Supported Futures
Full size: ES, NQ, YM, RTY, GC, CL, ZB, ZN, 6E, 6J
Micros: MES, MNQ, MYM, M2K, MGC, MCL
Notes
Made this primarily for my own ES trading but figured others might find it useful
The tick values are based on standard CME specs
If you trade other futures, you can modify the code to add them
Works great alongside level indicators for risk management
Why This Exists
I use ATR trailing stops on all my trades and got tired of doing mental math every time I switched between charts or contracts. Especially useful if you trade both full-size and micro contracts - the risk difference is huge and easy to mess up.
Hope this helps your trading! Feel free to suggest improvements.

Mickey's Breaker Engine⚡ Breaker Engine | Auto Retest + Smart R:R Targets
A precision-grade breaker-block detection system built for traders who live and breathe clean structure.
This indicator automatically detects Breaker Candles, confirms them, marks their zones, and executes intelligent retest-based entry logic — complete with Stop-Loss and Risk-to-Reward (R:R) tracking up to 3R (or any custom ratio).
🧠 Core Concept
A Breaker Block is a structural shift where price violates liquidity from a failed order block and flips the zone’s polarity — turning a former supply into demand (or vice-versa).
This script identifies those setups automatically, confirms them only after a valid structure break, and waits for a clean retest to trigger a trade signal.
🚀 Key Features
⚙️ Smart Zone Detection
Detects both Bullish Breakers and Bearish Breakers.
Zones are drawn precisely using the breaker’s middle candle body (or full wick range if enabled).
Fully configurable transparency, width, and extension for better visual context.
🎯 Auto Retest Entry Logic
Entry triggers only on a clean retest, not on immediate breakout.
Includes logical filters to ensure retests are structurally valid and not overlapping candles.
Works in any timeframe or market — crypto, forex, indices, or commodities.
💡 Dynamic Risk–Reward Tracking
Automatically plots 1R, 2R, 3R, ...R targets based on your defined stop range.
Risk is calculated from entry to zone boundary or ATR offset.
Each target label appears precisely when hit.
Targets automatically stop updating once Stop-Loss is triggered.
🧱 Visual Clarity
BUY 🟢 / SELL 🔴 bubbles at entries.
SL ❌ marker when stop is hit.
🎯 1R / 2R / 3R labels dynamically plotted when each reward level is reached.
Non-overlapping placement using ATR-based spacing.
⚡ Real-Time Alerts - Instant alerts for:
✅ “Breaker BUY” – Clean retest confirmed (Long setup)
✅ “Breaker SELL” – Clean retest confirmed (Short setup)
❌ “Breaker BUY SL” – Stop hit for Long
❌ “Breaker SELL SL” – Stop hit for Short
🧩 Customization Panel
| Setting | Description |
| :-------------------------- | :------------------------------------------------------------------------------ |
| **ATR Length** | Controls volatility-based offset sizing. |
| **Entry / SL Offset × ATR** | Adjusts label spacing and dynamic positioning. |
| **Risk-Reward Ratio** | Define default R:R (e.g. 1:3). |
| **Multiple Retests** | Enable if you want the same breaker zone to allow multiple retests/entries. |
| **Banner Design** | Control opacity, extension, and wick usage for the breaker block visualization. |
| **Color Controls** | Choose your BUY/SELL/SL bubble colors to match your chart theme. |
⚙️ Underlying Logic (At a Glance)
Pattern Detection:
Identifies a 5-bar sequence that forms a valid Breaker Candle (the middle bar flips structure).
Confirmation:
Requires a follow-through candle to validate a real liquidity break.
Zone Registration:
Stores the breaker zone’s body range in arrays for tracking.
Clean Retest Entry:
Waits for price to retest the zone from the opposite side and close cleanly inside.
Stop Loss / Target Projection:
Defines stop loss just beyond the zone and plots up to 3 × reward targets dynamically.
Monitoring & Alerts:
Tracks each setup independently until either an R-target or SL is reached.
💬 Recommended Usage
Works best with market-structure traders, smart-money concepts, or liquidity-based systems.
Combine it with an external displacement confirmation or BOS/CHOCH tool for best precision.
Ideal for backtesting breaker-based R:R consistency or forward-testing retest entries.
Compatible with any asset / timeframe.
🧭 Disclaimer
This script is for educational and analytical purposes only.
It is not financial advice and should not be used to make trading decisions without independent confirmation or risk management.
Always test on demo data before deploying live.

MTF EMA Trading SystemHere's a comprehensive description and usage guide for publishing your MTF EMA Trading System indicator on TradingView:
MTF EMA Trading System - Pro Edition
📊 Indicator Overview
The MTF EMA Trading System is an advanced multi-timeframe exponential moving average indicator designed for traders seeking high-probability setups with multiple confirmations. Unlike simple EMA crossover systems, this indicator combines trend alignment, momentum, volume analysis, and previous day confluence to generate reliable long and short signals with optimal risk-reward ratios.
✨ Key Features
1. Multi-Timeframe EMA Analysis
Configure 5 independent EMAs (default: 9, 21, 50, 100, 200)
Each EMA can pull data from ANY timeframe (5m, 15m, 1H, 4H, 1D, etc.)
Color-coded lines with customizable widths
End-of-line labels showing EMA period and timeframe (e.g., "EMA200 ")
Perfect for analyzing higher timeframe trends on lower timeframe charts
2. Advanced Signal Generation (Beyond Simple Crosses)
The system requires MULTIPLE confirmations before generating a signal:
LONG Signals Require:
✅ Price action trigger (EMA cross, bounce from key EMA, or pullback setup)
✅ Bullish EMA alignment (EMAs in proper ascending order)
✅ Volume spike confirmation (configurable threshold)
✅ RSI momentum confirmation (bullish but not overbought)
✅ Sufficient EMA separation (avoids choppy/whipsaw conditions)
✅ Price above previous day's low (confluence with support)
SHORT Signals Require:
✅ Price action trigger (EMA cross, rejection from key EMA, or pullback setup)
✅ Bearish EMA alignment (EMAs in proper descending order)
✅ Volume spike confirmation
✅ RSI momentum confirmation (bearish but not oversold)
✅ Sufficient EMA separation
✅ Price below previous day's high (confluence with resistance)
3. Real-Time Dashboard
Displays critical market conditions at a glance:
Overall trend direction (Bullish/Bearish/Neutral)
Price position relative to all EMAs
Volume status (spike or normal)
RSI momentum reading
EMA confluence strength
EMA separation quality
Current ATR value
Previous day high/low levels
Current signal status (LONG/SHORT/WAIT)
Risk-reward ratio
4. Clean Visual Design
Large, clear trade signal markers (green triangles for LONG, red triangles for SHORT)
No chart clutter - only essential information displayed
Customizable signal sizes
Professional color-coded dashboard
5. Built-In Risk Management
ATR-based calculations for stop loss placement
1:2 risk-reward ratio by default
All levels displayed in dashboard for easy reference
🎯 How to Use This Indicator
Step 1: Initial Setup
Add the indicator to your TradingView chart
Configure your preferred timeframes for each EMA:
EMA 9: Leave blank (uses chart timeframe) - Fast reaction to price
EMA 21: Leave blank or set to 15m - Key pivot level
EMA 50: Set to 1H - Intermediate trend
EMA 100: Set to 4H - Major trend filter
EMA 200: Set to 1D - Overall market bias
Adjust signal settings based on your trading style:
Conservative: Keep all confirmations enabled
Aggressive: Disable volume or momentum requirements
Scalping: Reduce min EMA separation to 0.2-0.3%
Step 2: Reading the Dashboard
Before taking any trade, check the dashboard:
Trend: Only take LONG signals in bullish trends, SHORT signals in bearish trends
Position: Confirm price is on the correct side of EMAs
Volume: Green spike = strong confirmation
RSI: Avoid extremes (>70 or <30)
Confluence: "Strong" = high probability setup
Separation: "Good" = trending market, avoid "Low" separation
Step 3: Trade Entry
For LONG Trades:
Wait for green triangle to appear below price
Verify dashboard shows:
Bullish or Neutral trend
Volume spike (preferred)
RSI between 50-70
Good separation
Enter at market or on next bar
Set stop loss at: Entry - (ATR × 2)
Set target at: Entry + (ATR × 4)
For SHORT Trades:
Wait for red triangle to appear above price
Verify dashboard shows:
Bearish or Neutral trend
Volume spike (preferred)
RSI between 30-50
Good separation
Enter at market or on next bar
Set stop loss at: Entry + (ATR × 2)
Set target at: Entry - (ATR × 4)
Step 4: Trade Management
Use the ATR values from dashboard for position sizing
Trail stops using the fastest EMA (EMA 9) as price moves in your favor
Exit partial position at 1:1 risk-reward, let remainder run to target
Exit immediately if dashboard trend changes against your position
💡 Best Practices
Timeframe Recommendations:
Scalping: 1m-5m chart with 5m, 15m, 1H, 4H, 1D EMAs
Day Trading: 5m-15m chart with 15m, 1H, 4H, 1D EMAs
Swing Trading: 1H-4H chart with 4H, 1D, 1W EMAs
Position Trading: 1D chart with 1D, 1W, 1M EMAs
Market Conditions:
Best in: Trending markets with clear direction
Avoid: Tight consolidation, low volume periods, major news events
Filter trades: Only take signals aligned with higher timeframe trend
Risk Management:
Never risk more than 1-2% per trade
Use ATR from dashboard to calculate position size
Respect the stop loss levels
Don't force trades when dashboard shows weak conditions
⚙️ Customization Options
EMA Settings (for each of 5 EMAs):
Length (period)
Timeframe (multi-timeframe capability)
Color
Line width
Show/hide toggle
Signal Settings:
Volume confirmation (on/off)
Volume spike threshold (1.0-3.0x)
Momentum confirmation (on/off)
RSI overbought/oversold levels
Minimum EMA separation percentage
ATR period and stop multiplier
Display Settings:
Show/hide EMA labels
Show/hide trade signals
Signal marker size (tiny/small/normal/large)
Show/hide dashboard
🔔 Alert Setup
The indicator includes 4 alert conditions:
LONG Signal - Fires when all long confirmations are met
SHORT Signal - Fires when all short confirmations are met
Bullish Setup - Early warning when trend aligns bullish with volume
Bearish Setup - Early warning when trend aligns bearish with volume
To set up alerts:
Right-click on chart → Add Alert
Select "MTF EMA Trading System"
Choose your desired alert condition
Configure notification method (popup, email, SMS, webhook)
📈 Performance Tips
Increase Win Rate:
Only trade in direction of higher timeframe trend
Wait for volume spike confirmation
Avoid trades during first 30 minutes and last 15 minutes of session
Skip trades when separation is "Low"
Reduce False Signals:
Increase minimum EMA separation to 0.7-1.0%
Enable all confirmation requirements
Only trade when confluence shows "Strong"
Combine with support/resistance levels
Optimize for Your Market:
Stocks: Use 9, 21, 50, 100, 200 EMAs
Forex: Consider 8, 13, 21, 55, 89 EMAs (Fibonacci)
Crypto: May need wider ATR multiplier (2.5-3.0x) for volatility
⚠️ Important Notes
This indicator is designed to reduce false signals by requiring multiple confirmations
No indicator is 100% accurate - always use proper risk management
Backtesting recommended before live trading
Market conditions change - adjust settings as needed
Works best in liquid markets with clear price action
🎓 Conclusion
The MTF EMA Trading System transforms simple moving average analysis into a sophisticated, multi-confirmation trading strategy. By combining trend alignment, momentum, volume, and confluence, it helps traders identify high-probability setups while filtering out noise and false signals. The clean interface and comprehensive dashboard make it suitable for both beginners and experienced traders across all markets and timeframes.

ATR Daniel# ATR Daniel - Indicator Description
## 🇬🇧 ENGLISH VERSION
### ATR Daniel - Smart Trailing Stop Manager
**ATR Daniel** is an intelligent trailing stop indicator that automatically adapts to your trading style and the asset you're trading.
#### Key Features:
**🎯 3 Trading Modes:**
- **Swing Trading** - For position trading with wider stops
- **Intraday** - For day trading with balanced parameters
- **Scalping** - For quick trades with tight stops
**📊 Automatic Asset Detection:**
The indicator automatically recognizes 3 major assets and applies optimized parameters:
- **XAUUSD (Gold)** - Lower volatility settings
- **BTCUSDT (Bitcoin)** - Medium volatility settings
- **NAS100USD (Nasdaq 100)** - Higher volatility settings
**🔧 Flexible Configuration:**
- **Auto Mode**: Applies optimal parameters based on detected asset and selected trading mode
- **Manual Mode**: Customize ATR length and multiplier to your preferences
- **Customizable Colors**: Choose your own line color
- **ON/OFF Display**: Toggle line visibility as needed
**📈 Visual Display:**
- Dynamic trailing stop line that follows price action
- Color changes based on trend direction (bullish/bearish)
- Real-time info table showing:
- Current asset
- Trading mode
- ATR value
- Stop loss distance
- Recommended SL price
- Current trend direction
- Signal arrows at trend reversals (optional)
**💡 How It Works:**
The indicator uses ATR (Average True Range) to calculate dynamic stop loss levels that adapt to market volatility. The trailing stop follows the price in trending markets while protecting your position.
**Perfect for:**
- Traders who want automated stop loss management
- Multi-asset traders (Gold, Bitcoin, Nasdaq)
- All trading styles (Swing, Intraday, Scalping)
---

ATR_XAUUSD-BITCOINT-US100_Daniel# ATR Daniel - Indicator Description
## 🇬🇧 ENGLISH VERSION
### ATR Daniel - Smart Trailing Stop Manager
**ATR Daniel** is an intelligent trailing stop indicator that automatically adapts to your trading style and the asset you're trading.
#### Key Features:
**🎯 3 Trading Modes:**
- **Swing Trading** - For position trading with wider stops
- **Intraday** - For day trading with balanced parameters
- **Scalping** - For quick trades with tight stops
**📊 Automatic Asset Detection:**
The indicator automatically recognizes 3 major assets and applies optimized parameters:
- **XAUUSD (Gold)** - Lower volatility settings
- **BTCUSDT (Bitcoin)** - Medium volatility settings
- **NAS100USD (Nasdaq 100)** - Higher volatility settings
**🔧 Flexible Configuration:**
- **Auto Mode**: Applies optimal parameters based on detected asset and selected trading mode
- **Manual Mode**: Customize ATR length and multiplier to your preferences
- **Customizable Colors**: Choose your own line color
- **ON/OFF Display**: Toggle line visibility as needed
**📈 Visual Display:**
- Dynamic trailing stop line that follows price action
- Color changes based on trend direction (bullish/bearish)
- Real-time info table showing:
- Current asset
- Trading mode
- ATR value
- Stop loss distance
- Recommended SL price
- Current trend direction
- Signal arrows at trend reversals (optional)
**💡 How It Works:**
The indicator uses ATR (Average True Range) to calculate dynamic stop loss levels that adapt to market volatility. The trailing stop follows the price in trending markets while protecting your position.
**Perfect for:**
- Traders who want automated stop loss management
- Multi-asset traders (Gold, Bitcoin, Nasdaq)
- All trading styles (Swing, Intraday, Scalping)
---

Position Sizer (Share Qty)
This indicator enables fast & accurate position sizing for traders using (user defined) fixed dollar risk, eliminating the need for manual calculations and supporting disciplined risk management directly on the chart
Calculates precise share quantity for fixed-risk trades using the formula Shares = Risk Amount / (Current Price – Stop Price), rounded to the nearest whole share, updating in real time on every bar
Offers two dynamic stop-loss options: Low of Day (LoD) — tracked only during Regular Trading Hours (9:30 AM – 4:00 PM ET) with automatic daily reset — or Low of Week (LoW) via weekly timeframe data
Displays all critical trade data in a clean, customizable on-screen table showing: Risk Amount, Stop Loss type (LoD/LoW), Stop Price, and calculated Shares Qty
Allows full table placement control with four corner positions with optional Top Offset and Bottom Offset (0–20 blank rows each) to prevent overlap with price action or other indicators
Provides complete visual styling control for header text/background, value text/background, and share quantity text/background
Ensures efficient rendering by recreating the table only when position, row count, or layout changes, deleting the prior instance to avoid flicker or memory issues
Handles edge cases safely: shows 0 shares if stop is 'na' or above current price, and initializes LoD only on the first RTH bar of each session
For use on equities only (table will not display on futures instruments)
--
Future improvements:
Visual Stop Loss line for either LoD or LoW
Functionality and toggle to include Extended hours (PM /AH) for LoD stop pricing

Iron Condor & Butterfly VisualizerIt helps you visualize and manage your option spread by:
Plotting strike prices and breakeven lines directly on the chart.
Showing profit/loss zones, adjustment zones, and alerts when price nears critical levels.
Calculating risk/reward, probability of profit, theta decay, IV condition, and trade score.
🎯 2. Inputs & Configuration
You input your trade details as a comma-separated string:
For an Iron Condor
ShortCall, LongCall, ShortPut, LongPut, Credit, Contracts, Target%
Example: 626,628,620,618,1.20,1,30
For a Butterfly Spread
LowerWing, Body, UpperWing, Debit, Contracts, Target%
Example: 600,620,640,2.50,2,50
The indicator automatically parses this and knows which strategy type you selected.
You can also control:
Visuals (profit zones, breakevens, labels)
Risk (stop loss %, adjustment zones)
Account/risk sizing
Market conditions (IV Rank, current IV, DTE)
⚙️ 3. Data Parsing & Strategy Recognition
The code reads your pasted string, splits it by commas, and determines:
Which strikes are short vs long (or wings/body for Butterfly)
Whether the strategy is credit (Iron Condor) or debit (Butterfly)
Calculates net credit/debit, contract size, and profit target
📈 4. Profit/Loss Calculations
It dynamically calculates:
Max Profit
Iron Condor: net credit × 100 × contracts
Butterfly: (wing width − debit) × 100 × contracts
Max Loss
Iron Condor: difference between strikes minus credit
Butterfly: debit × 100 × contracts
Breakeven points
Iron Condor: short strikes ± net credit
Butterfly: body ± debit
Current P&L relative to the live price (close).
⚖️ 5. Risk & Position Sizing
It checks:
Stop-loss trigger (% of max loss)
Adjustment alert if price nears short strikes
Recommended contract size based on account size and % risk per trade
Actual % of account at risk
⏱️ 6. Time Decay & IV Analysis
If you input days to expiration, it shows:
Theta (approx daily time decay)
Decay progress bar (% of 30-day cycle)
IV condition:
Green: favorable (>50 IV Rank)
Yellow: neutral (30–50)
Red: poor (<30)
🧮 7. Trade Scoring
It gives a Trade Score (0–100) based on:
IV Rank (favorable market)
Risk/Reward ratio
Probability of profit
Default 20 baseline points
This helps gauge whether the setup is statistically attractive.
🧠 8. Visualizations
When the indicator runs, it draws on your chart:
Lines
Red = short strikes
Orange dashed = long strikes
Yellow dotted = breakeven levels
Boxes
Green = profit zone
Orange shaded = adjustment zones (approaching danger)
Labels (optional)
Strike labels (call/put prices)
Info box summarizing:
Profit, loss, risk/reward
Breakevens, theta, target, gamma risk flag
🚨 9. Alerts
The script triggers TradingView alerts when:
Price nears call or put adjustment zones
Profit target is hit
Stop loss is hit
These help you manage the trade without constant monitoring.
🧭 10. In Practice
You’d:
Copy the option strikes and trade details from your broker or analyzer.
Paste them into 📋 PASTE YOUR TRADE DATA HERE.
The indicator plots:
Profit/loss region
Adjustment warnings
Key metrics
Alerts if your trade is in danger or near target.
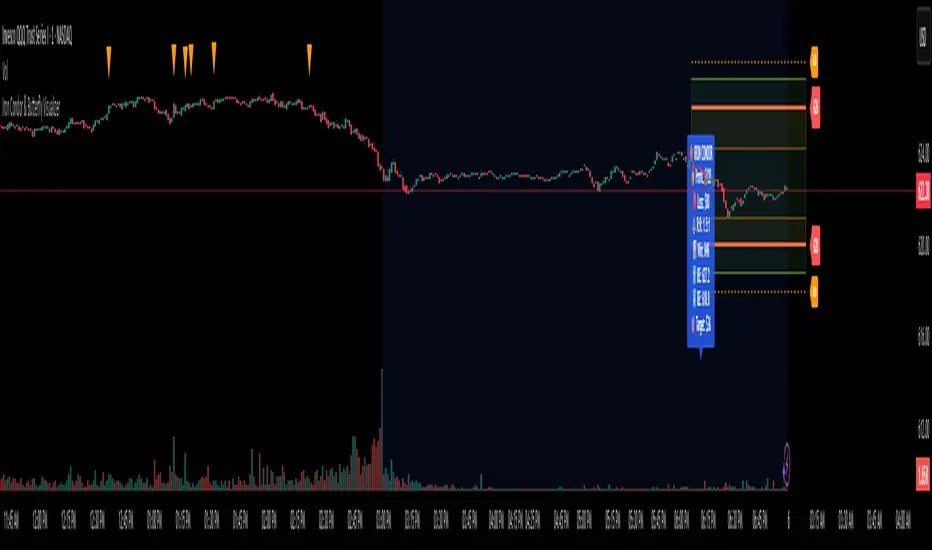
Liquidity Sweep & Reversal — Body Anchored + Risk (v6)Overview
The Liquidity Sweep & Reversal — Locked to Price (v6) indicator identifies liquidity sweeps around major swing highs and lows, confirming reversals when price closes back inside the swept level.
All signals are locked to price (bottom of green candle for BUY, top of red candle for SELL), so they remain perfectly aligned when zooming or scaling.
This indicator is ideal for swing traders and scalpers who trade reversals, liquidity events, and reclaim structures.
How It Works
Detects confirmed swing highs and lows using a pivot-based structure.
Waits for a liquidity sweep — when price wicks beyond a recent swing.
Confirms a reclaim when price closes back inside the previous swing level.
Triggers a BUY or SELL signal anchored to the candle body.
Automatically calculates stop loss and risk using ATR and your inputs.
Input Settings
Swing Detection
Swing Detection Strength: How many bars confirm a swing pivot. Higher = stronger swings.
Bars to Confirm Reclaim: Number of bars after a sweep for price to close back within the swing zone.
Swing Proximity %: How close price must come to a swing to count as a liquidity sweep.
Trend Filter (optional)
Use EMA Trend Filter: When enabled, only BUY in uptrend and SELL in downtrend.
Fast EMA Length / Slow EMA Length: Define EMAs used to detect trend direction.
Risk & Stop Management
ATR Length: Period for ATR calculation (volatility measurement).
Base ATR Stop Buffer (x ATR): Distance of stop loss from entry based on ATR multiplier.
Position Size (quote units): Your total position size in quote currency (e.g., USDT).
Risk % of (Position / 20): Defines how much of your position to risk per trade.
Example: (Position / 20) × Risk % = per-trade risk.
Chart Elements
BUY Arrow (green): Appears after a liquidity sweep and reclaim near a swing low.
SELL Arrow (red): Appears after a sweep and reclaim near a swing high.
Labels: Display entry price, stop loss (SL), and calculated risk dollar value.
EMAs: Optional fast/slow moving averages for directional bias.
Dynamic Stops: Adjust automatically using ATR × risk settings.
Trading Tips
Use BUY signals near liquidity sweeps under swing lows.
Use SELL signals near liquidity sweeps above swing highs.
Adjust swing length for different timeframes:
Lower values for scalping (3–5)
Higher values for swing trading (7–10)
Respect stop loss levels and use risk control settings for consistent sizing.
Combine with volume, OBV, or structure for confirmation.
Alerts
BUY — Locked to Price: "BUY: swing low reclaimed with dynamic stop."
SELL — Locked to Price: "SELL: swing high reclaimed with dynamic stop."
Best Use Cases
Liquidity-based reversals
Swing entry confirmation
Stop hunt reclaims
Structure-based entries
Author
Created by @roccodallas
For traders who value clean structure, risk control, and chart precision.
